Three screens in the admin console answer three questions: is the platform healthy, who uses it and how, and does each Capability still earn its place.
Check health
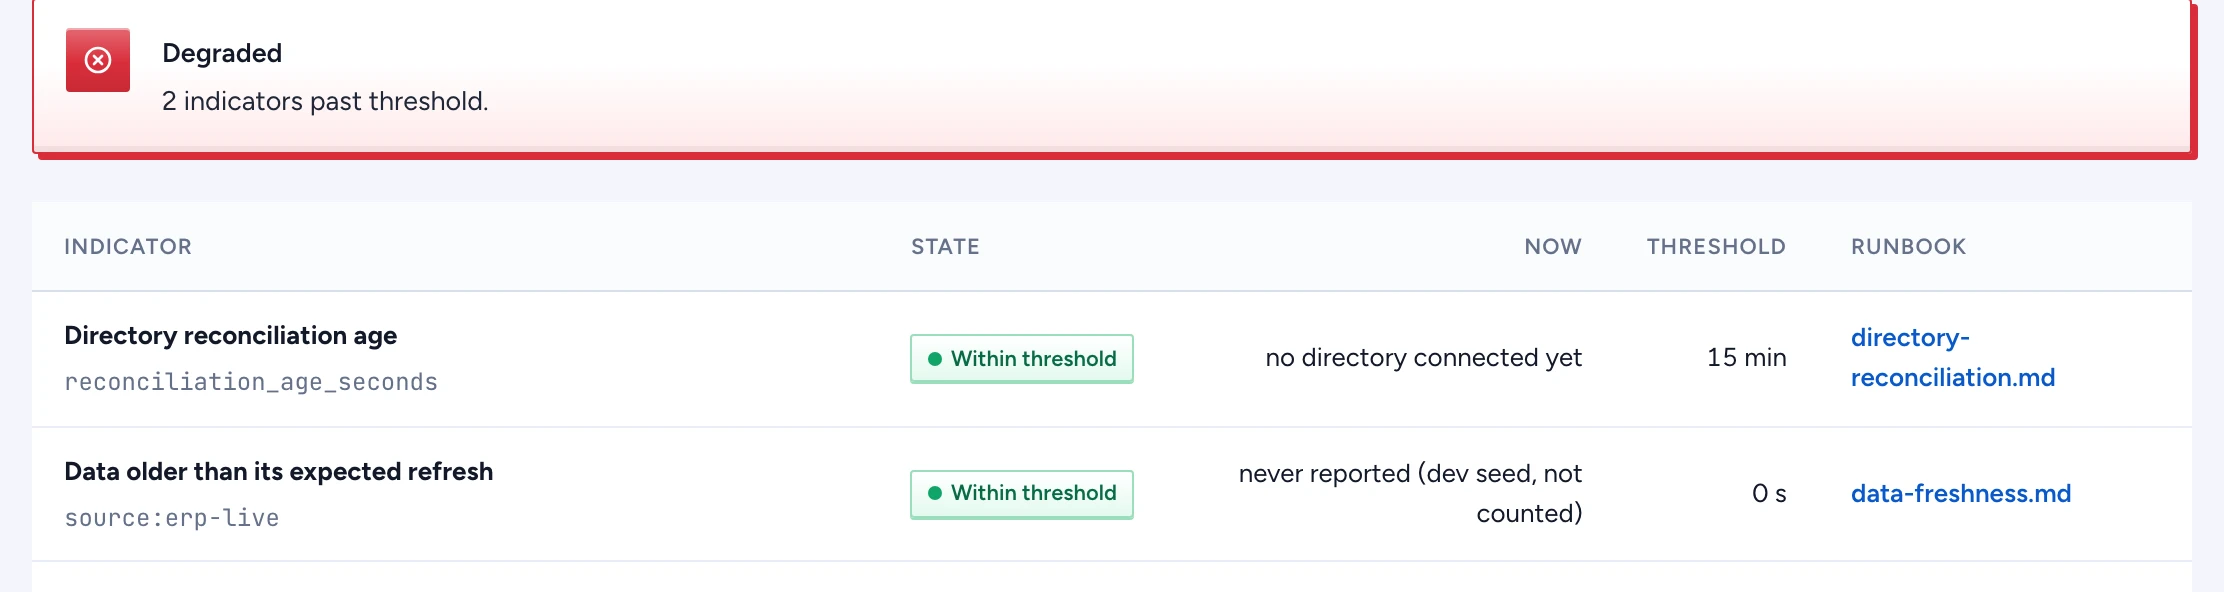
Open Health & pipeline > Health. The callout at the top reads Degraded with the number of indicators past threshold, or says all indicators are within threshold. On a fresh install, in the first 15 minutes and before the worker's first probe has run, it reads Waiting for the first data instead: a check that has never run is neither breached nor fine. A check that answered with an error is breached all the same. From the first probe result on, or after those 15 minutes, a source that has never reported counts as breached again, so a worker that never started still shows. On a local dev install the seeded sources have no connector, so there a source that never reported or never synced reads "dev seed, not counted" and does not count. The Indicators table gives each Indicator its State (Within threshold, Waiting for data or Breached), the value Now, the Threshold and a Runbook link. Work through the runbook of every breached row.
| Indicator | Breached when |
|---|---|
| Directory reconciliation age | over 15 minutes |
| ACL lag, per source | over 15 minutes, or never synced |
| Data older than its expected refresh | any source past its expect |
| Queue age | over 5 minutes |
| Audit buffer fill | over 50% |
| Model route, per model | the route is down |
| Model spend used | over 85% of a department's cap |
| Storage adapter | the adapter does not answer |
| Authorisation cache age | over 60 seconds |
| Probe | a probe failed, or three periods passed without a result |
| Versions served to the audience | more than one version serves an audience |
Probes run every minute: the database, the audit buffer, the storage adapter, the model gateway when one is configured, and a permission check that must be denied. Every ten minutes a synthetic question goes through chat, the API and MCP in turn, and usage never counts it. The first failure in a streak sends "A health probe failed" to every security officer.
Watch live activity
Open Health & pipeline > Live activity, or go straight to /live on the admin address, to watch recent governed activity as it is recorded. It opens as a full-screen page of its own, without the console sidebar, so it can run on a wall screen; Open audit log takes you back into the console. The newest record runs through five lanes (source, context, policy, route, effects) and the list below shows the last eight. The screen shows metadata only: what kind of action ran, on which channel, its outcome, and counts of retrieved, withheld, allowed and denied objects. It never shows who acted, which object or request, or any question, answer or citation; open the Audit log for that. Watching does not add records to the audit log.
A stage the record does not report says Not reported. Control health counts healthy, breached and waiting checks separately, so a check still waiting for data never counts as healthy. When the activity read fails, the screen keeps the last snapshot, says Stale since with its time, and stops the moving flow until Try again succeeds. When only the health read fails, the activity stays live and Control health says Health did not load instead of an old percentage. Pause motion stops all animation.
Read usage
Open Health & pipeline > Usage. It covers the last 30 days from audit metadata, with no prompt text and no ranking of people. Tables break down questions, active people, withheld rate and refusal rate By department, By channel and By client, the OAuth client a question came through. Rate limited clients lists the clients that hit their limit. Feedback, actions and spend adds helpfulness, action runs, approval times and spend per department.
Any group smaller than the cohort is left out, and a second cell is hidden where needed so the first cannot be worked out by subtraction. Set the cohort in Smallest reportable group: the default is 10, the floor is 5, and every change is audited. Spend that a service account booked, such as the ontology miner's extractions through its API key, is not a person's: Spend by service account names the account with its Capability and channel, outside the cohort rule. A key that acts for one person counts as that person. When tier C approvals keep arriving within 30 seconds of the request, the screen flags possible rubber-stamping against the approver role. It names the role and leaves people out.
Review a Capability
Open Access & governance > Capability catalogue. Each row is one Capability: its state (live, not deployed, disabled or retired), its review (Review on schedule, Review due from 30 days before the date, Review overdue, Expired or No review date, with the date), its Test results (Meets its targets, how many are below target, Out of date, or Not tested yet) and its owners. Owners get "A capability is due for its value review" once it falls due. The notification opens the Capability's page.
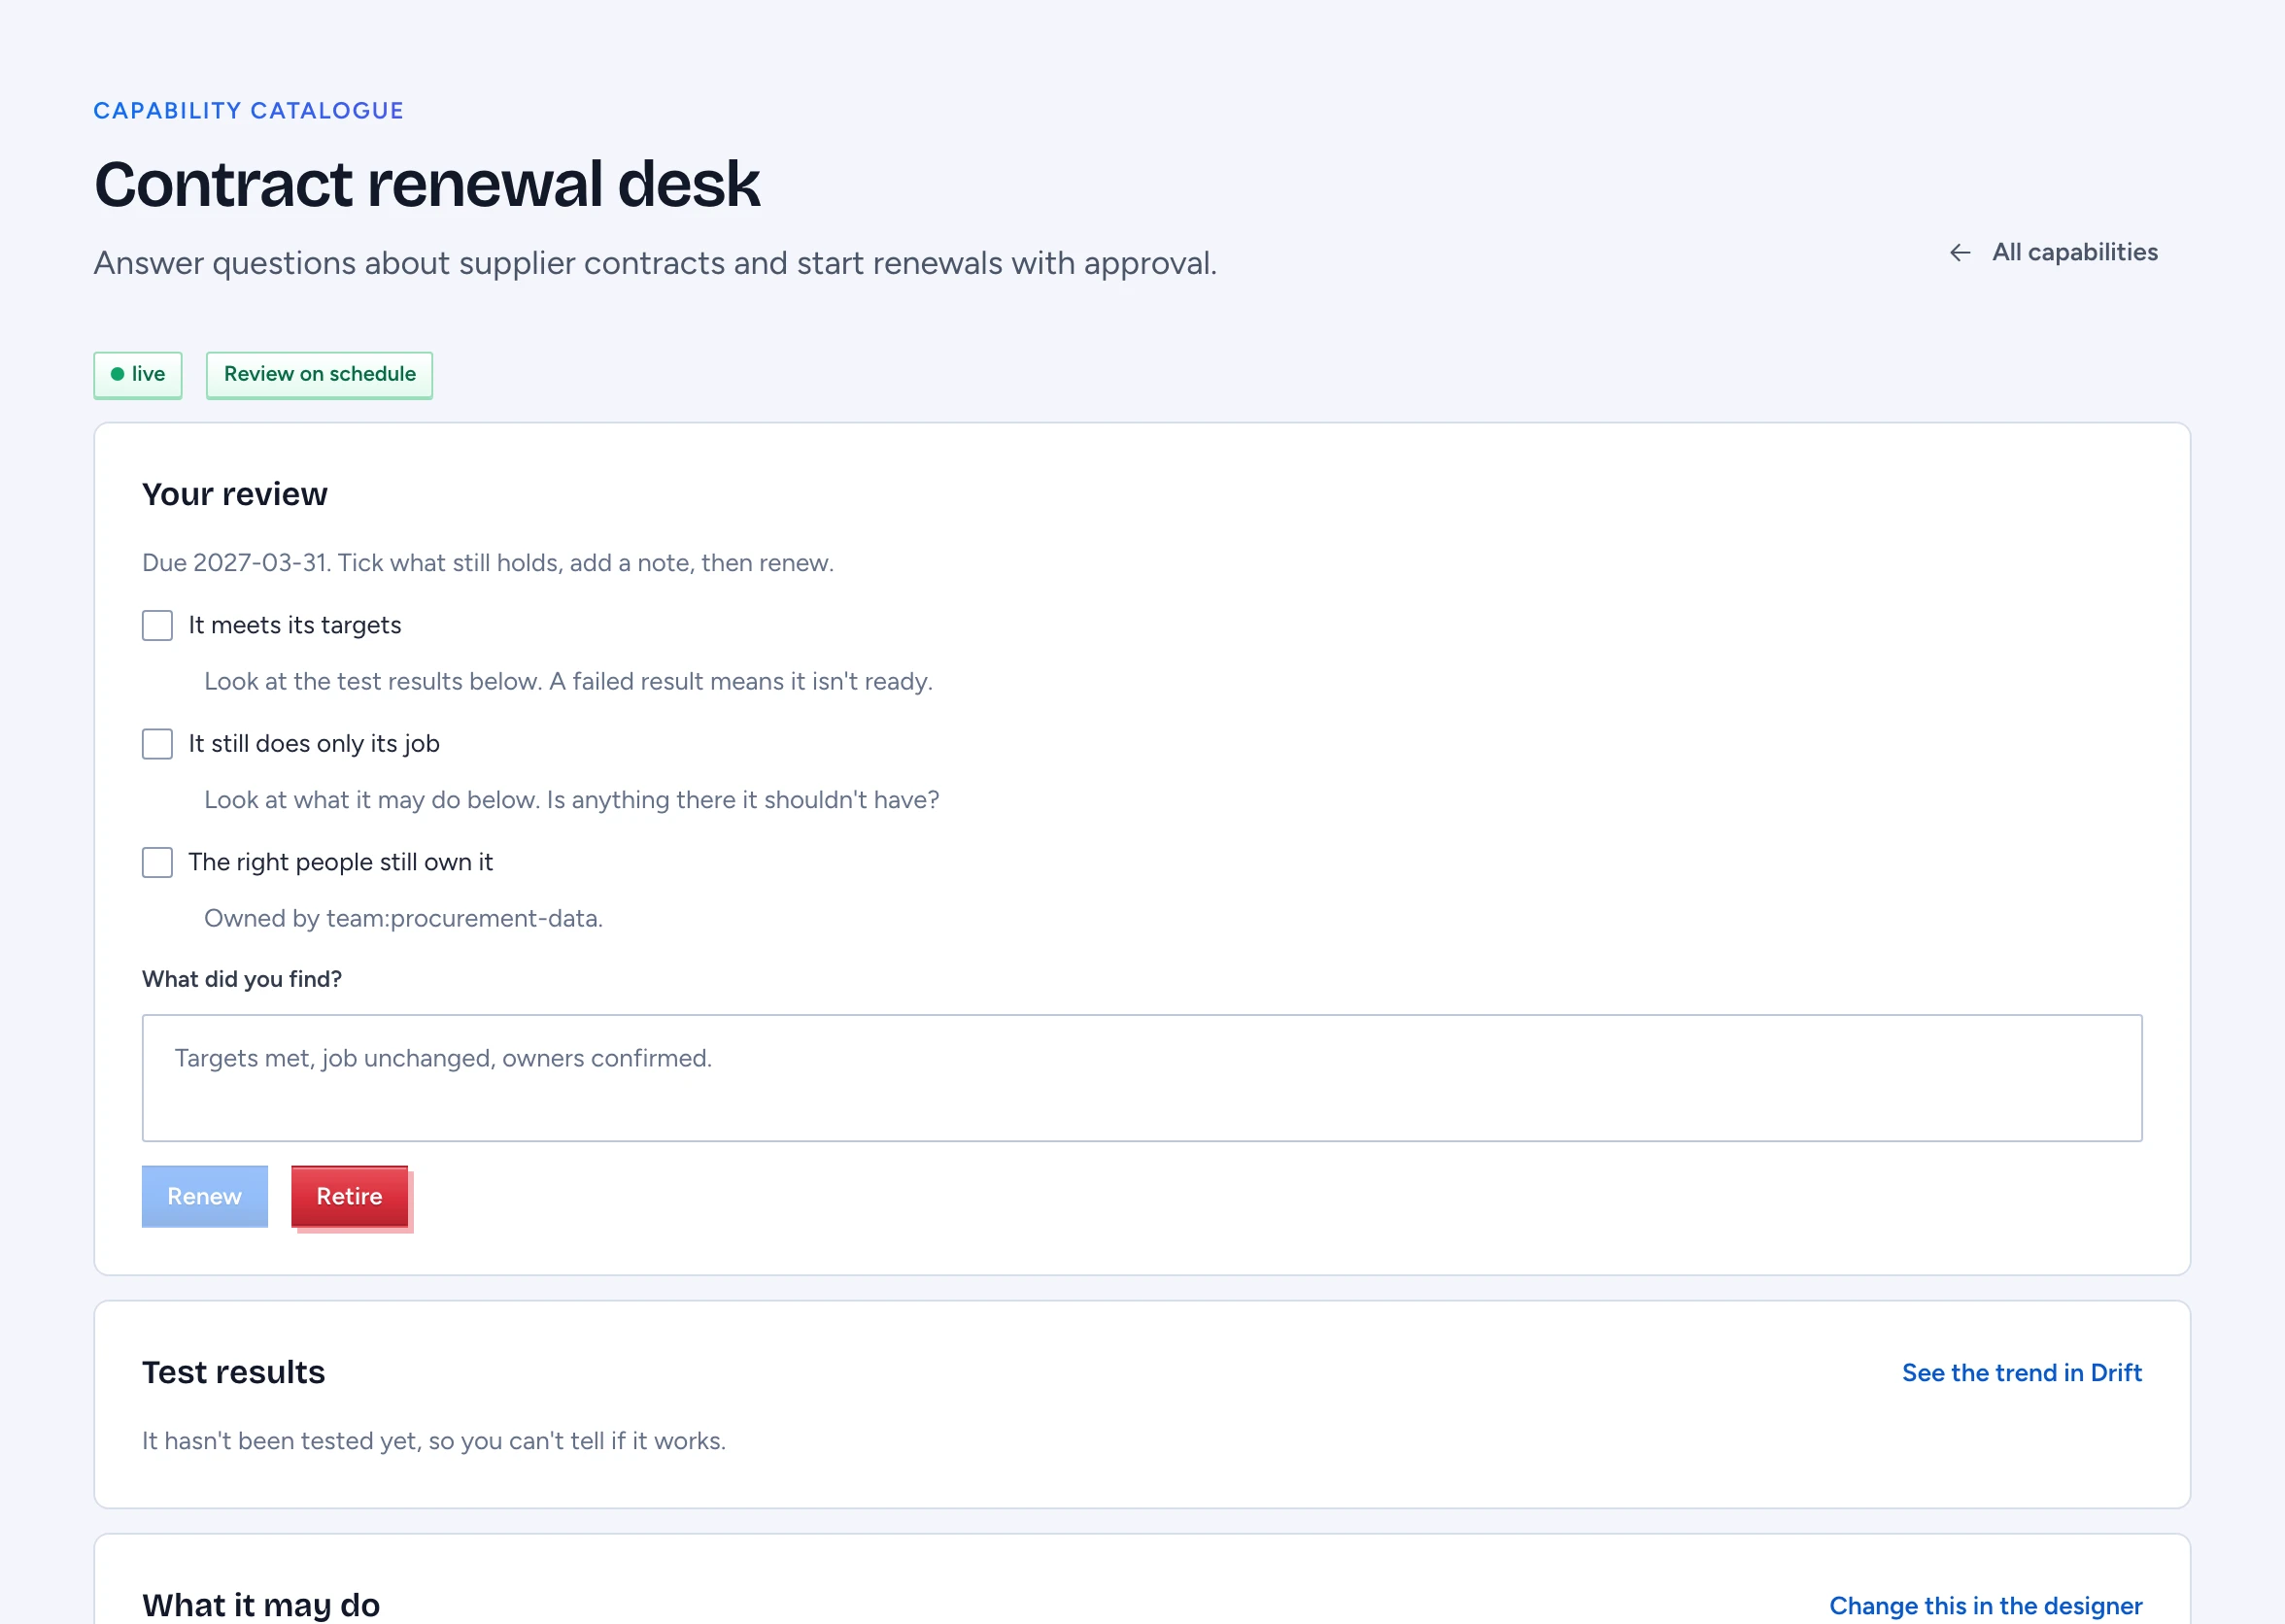
Click a Capability's name to open its page. Your review is at the top. Everything it asks about is below it:
- Test results: each test of the latest run with its score, its target and the result (Passed, Below target or Too few cases). See the trend in Drift shows how the scores moved over time.
- What it may do: who it affects, what to never use it for, what it can read, the actions it can take, the tools it can call, where people use it, and its risk. Change this in the designer opens the designer, because scope changes by proposal.
- Where it's live: each deployment, its version and who can use it.
- Why it exists: how the work was done before, what success looks like and how it's measured.
- Recent use: the latest requests made through it, with what was asked or run and how it ended. Owners see Someone where the person would be: who asked is withheld from them. Security officers see who asked and get Open the audit log. Each read is recorded in the audit log.
To review it:
- Tick It meets its targets, It still does only its job and The right people still own it.
- Write What did you find?
- Choose Renew. It stays disabled until all three are ticked and the note is filled. The note is recorded in the audit log.
The Review by date lives in GOL, so moving it on is a proposal in the designer.
Retire asks why, then stops every channel from using it at once through the kill switch. Its test results and history stay. Owners and security officers are told.
Security officers see every entry. A Capability owner sees and decides only their own.